Digs & Discoveries
Suspicious Silver
By DANIEL WEISS
Friday, June 10, 2022
 In his work De Officiis, the first-century B.C. Roman author and orator Cicero alludes to a currency crisis that occurred around 86 B.C. “The coinage was being tossed around,” he writes, “so no one was able to know what he had.” Previous researchers who sampled metal from the surfaces of silver denarius coins from the period found only a slight decline in their purity. Now, a team led by archaeologists Kevin Butcher of the University of Warwick and Matthew Ponting of the University of Liverpool has drilled metal from the cores of coins and found evidence of a brief period of dramatic currency debasement.
Until 90 B.C., denarii were pure silver. They were then cut with increasing amounts of copper until the cheaper metal constituted up to 14 percent of the coins’ contents. “Because the Romans had been used to very pure silver coinage, that would have caused a loss of confidence in the value of the denarius,” says Butcher. At the time, Rome was entangled in several wars whose cost apparently led to the currency’s loss of value. “When you get to that level of debasement, you start to see changes to the color of the metal,” says Ponting. “People probably began to notice that things weren’t quite right.” Likely as a reaction to this decline in public confidence, denarii were restored to their former level of purity around 86 B.C.
Spice Hunters
By JASON URBANUS
Friday, June 10, 2022
 Sometimes referred to as “red gold,” saffron is the world’s most expensive spice. For thousands of years, it has been highly prized by many cultures across the Mediterranean world and the Near East for its use as a colorant, perfume, and food additive, and for its medicinal properties. Saffron is obtained from the stigmas of Crocus sativus, or saffron crocus, which only reproduces with human intervention. It can take as many as 8,000 flowers, which must be harvested by hand, to produce a single pound of saffron. The earliest evidence of people using wild crocus comes from saffron-derived pigments found in 50,000-year-old cave paintings in Iraq, but experts have debated when and where the plant was first domesticated.
New research drawing on both ancient art and genetic sequencing points to one place: Bronze Age Greece. This research has determined that the earliest known depictions of domesticated saffron are found in Minoan Age frescoes from the Greek island of Santorini that date to around 1600 B.C. “The saffron depictions in the Aegean artworks provide timelines into the past, pointing us to geographic locations,” says TU Dresden geneticist Tony Heitkam, “but to find out where saffron first arose, we also need to know where to look for its wild parents.” Genetic analysis revealed that the closest known relative to domesticated C. sativus is the wild C. cartwrightianus, which is found only in southern Greece. Thus, it is likely that the valuable plant was first domesticated there early in the second millennium B.C.
Save the Dates
By ERIC A. POWELL
Friday, June 10, 2022
 The first archaeological radiocarbon date in North America was obtained in 1949 from a piece of charcoal unearthed in central Nebraska that was found to be 5,000 years old. Since then, tens of thousands of dates have been obtained from sites across the United States and Canada. All the roughly 9,000 radiocarbon dates from Canadian archaeological sites are logged in the Canadian Archaeological Radiocarbon Database (CARD) maintained by the University of British Columbia, but until recently there had been no ongoing, systematic attempt to track radiocarbon dates from the United States.
Researchers led by University of Wyoming archaeologist Robert Kelly have sought to remedy this by conducting an exhaustive survey of documented radiocarbon dates in the lower 48 states, which they have added to CARD. Having a centralized repository for radiocarbon dates is vital, says Kelly. He points out that while dates on their own estimate the age of individual organic artifacts, hearths, and houses, when analyzed together, they can provide a powerful tool to track changes in human population across time. “The more people you have living on a landscape, the more cooking fuel, food, clothing, and building materials they’ll create,” says Kelly. “Our assumption is that if you have more dates, that’s because you have more stuff to date, and that’s generated by more people.”
Kelly was inspired to assemble the database because he wanted to track Indigenous migrations in Wyoming. “I realized that to look at migration patterns, I needed to look outside the state, and then outside the region,” he says. “The area we needed to get radiocarbon dates from just got bigger and bigger.” From 2014 to 2020, his team pored over journal articles, dissertations, and gray literature—the thousands of reports generated by research funded by private companies and government agencies—to identify as many radiocarbon dates as possible. To streamline the project, the team divided the country into three sections. Weber State University archaeologist Madeline Mackie, who was largely responsible for 25 eastern states, says the effort also involved contacting state historical preservation offices, universities, and any other organizations that compile their own databases of dates. Assessing the reliability of each date, says Mackie, was laborious. “It wouldn’t have been possible without a lot of people answering a lot of really weird emails from us—along the lines of ‘You ran a radiocarbon date thirty-five years ago, do you remember what the material was?’” she says.
The team has thus far identified 86,946 radiocarbon dates from U.S. archaeological sites, the largest number of which—about 250 in total—come from the Paleoindian shelter complex of Paisley Caves in Oregon. The dates collected by the team include about 3,000 obtained from human bones. Due to ethical concerns, dates taken from human remains will not be accessible to scholars who use CARD until the database’s administrators consult with descendant Indigenous communities about whether to make them available.
Kelly and his colleagues used the huge number of dates they have added to CARD to help model changes in population across North America over thousands of years. There are very few dates from before 10,000 years ago. The number of dates then increases steadily until around 2,000 years ago, after which the researchers identified a sharp jump, reflecting population growth driven by widespread adoption of agriculture across the continent. Then, around 1150, the number of dates drops precipitously. Kelly initially expected to find a wave of depopulation at this time rippling through the continent from the Northeast, perhaps representing the spread of diseases introduced by eleventh-century Norse settlers in Newfoundland. However, the decline didn’t happen that way, he says. “It wasn’t as simple as a movement from east to west.” Kelly suggests the population may have begun to drop in the mid-twelfth century because farmers living in increasingly larger villages became more susceptible to diseases endemic to North America. They may also have been more vulnerable to environmental changes. A climatic event known as the Medieval Warm Period around that time would have caused widespread drought. This was followed by an extended period of cool weather beginning around 1300, known as the Little Ice Age, which likely made agriculture less productive. “These farming populations just couldn’t catch a break,” says Kelly. “And then the Europeans arrived.”
Advertisement
Advertisement
IN THIS ISSUE
Digs & Discoveries
Save the Dates
Spice Hunters
Suspicious Silver
A Civil War Bomb
The Great Maize Migration
Mummy Makers
Dignity of the Dead
Sailing in Sumer
Speak, Memories
The Maya Count Begins
Hail to the Chief
Made in China
Off the Grid
Around the World
Notre Dame’s dignitaries, Bronze Age daggers, the world’s biggest quake, a lost snowshoe, and 50,000-year-old Australians
Artifact
A portable connection
Advertisement

Recent Issues
-
 May/June 2024
-
 March/April 2024
-
 January/February 2024
-
 November/December 2023
-
 September/October 2023
-
 July/August 2023
-
 May/June 2023
-
 March/April 2023
-
 January/February 2023
-
 November/December 2022
-
 September/October 2022
-
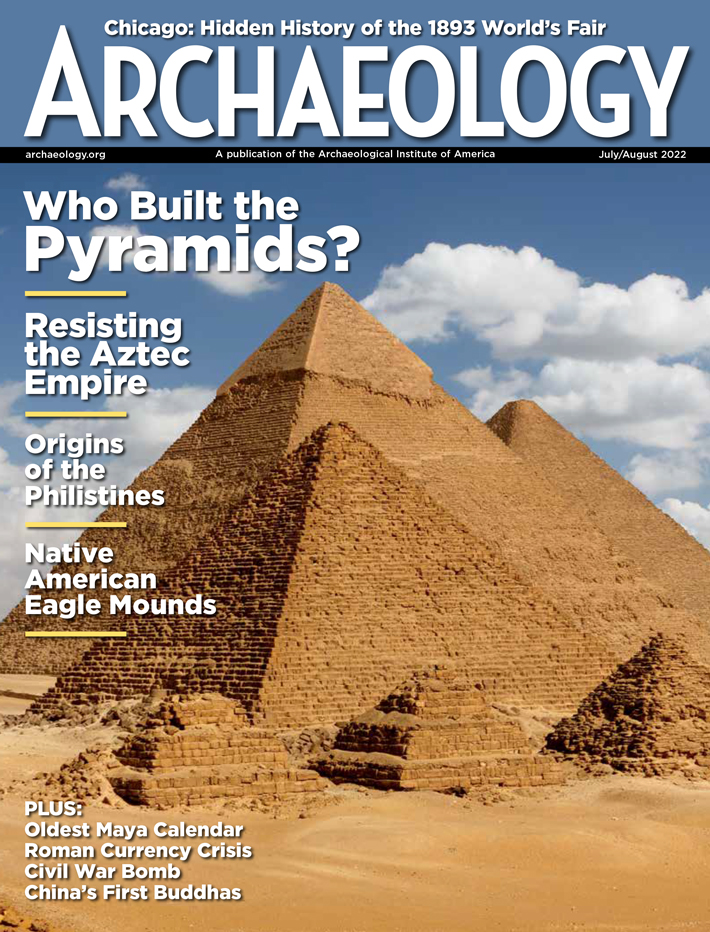 July/August 2022
-
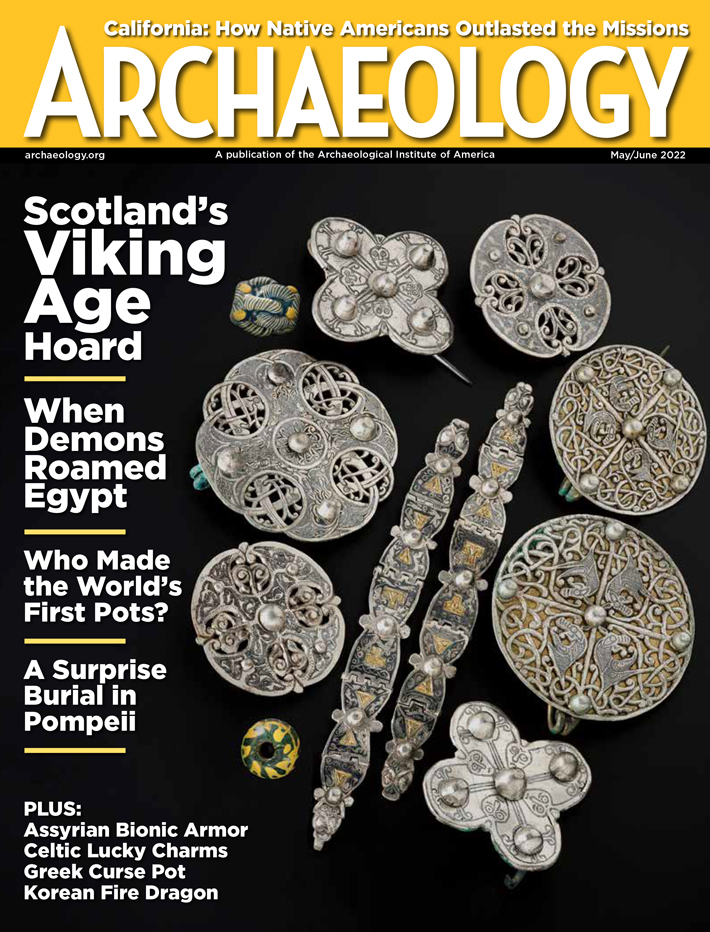 May/June 2022
-
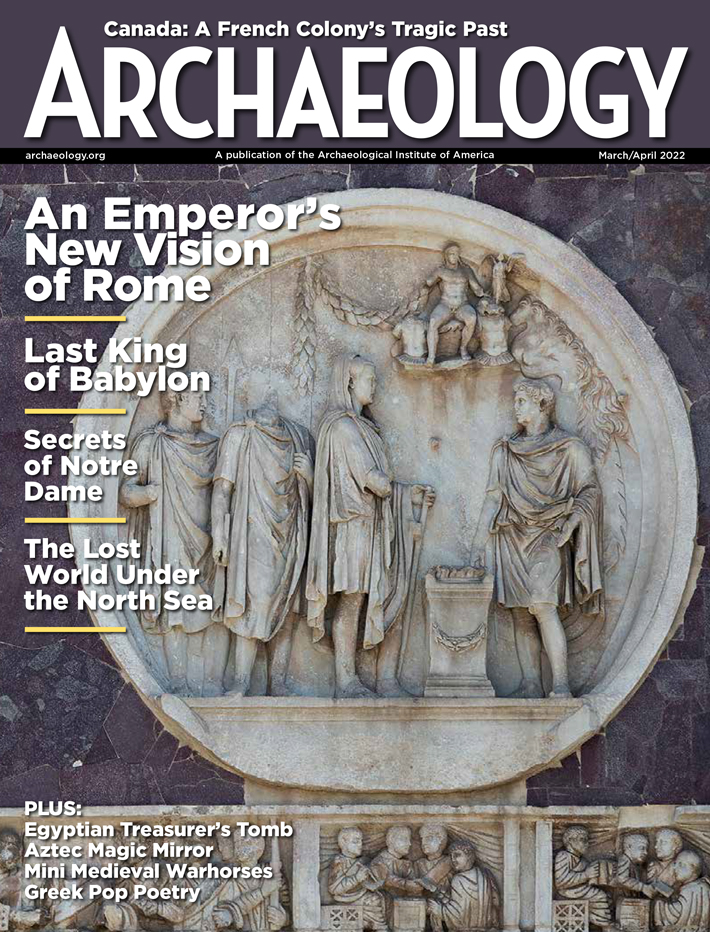 March/April 2022
-
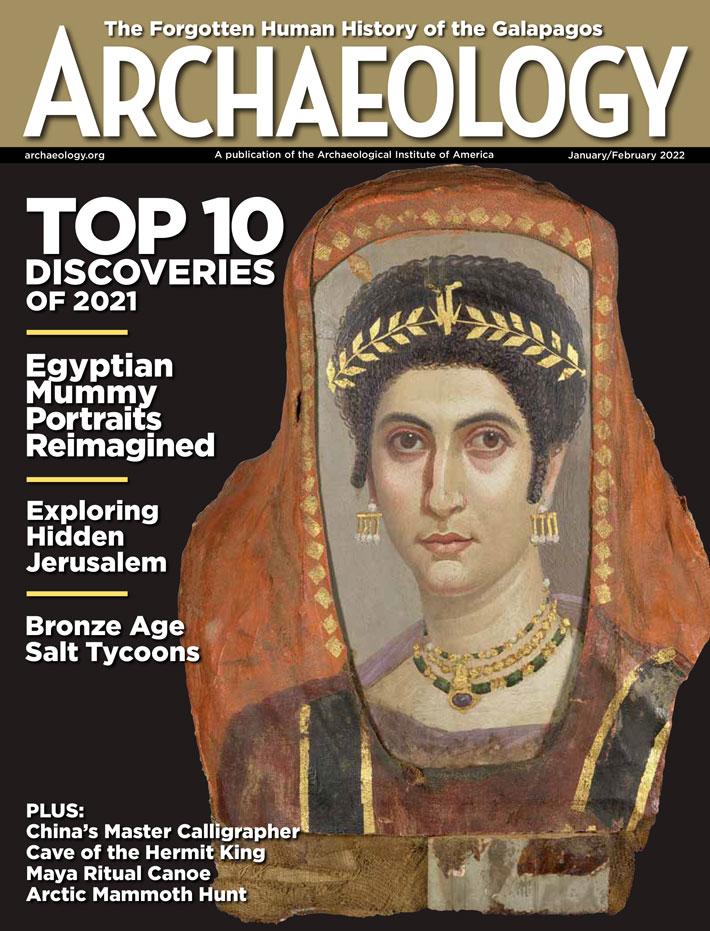 January/February 2022
-
 November/December 2021
-
 September/October 2021
-
 July/August 2021
-
 May/June 2021
-
 March/April 2021
-
 January/February 2021
-
 November/December 2020
-
 September/October 2020
-
 July/August 2020
-
 May/June 2020
-
 March/April 2020
-
 January/February 2020
-
 November/December 2019
-
 September/October 2019
-
 July/August 2019
-
 May/June 2019
-
 March/April 2019
-
 January/February 2019
-
 November/December 2018
-
 September/October 2018
-
 July/August 2018
-
 May/June 2018
-
 March/April 2018
-
 January/February 2018
-
 November/December 2017
-
 September/October 2017
-
 July/August 2017
-
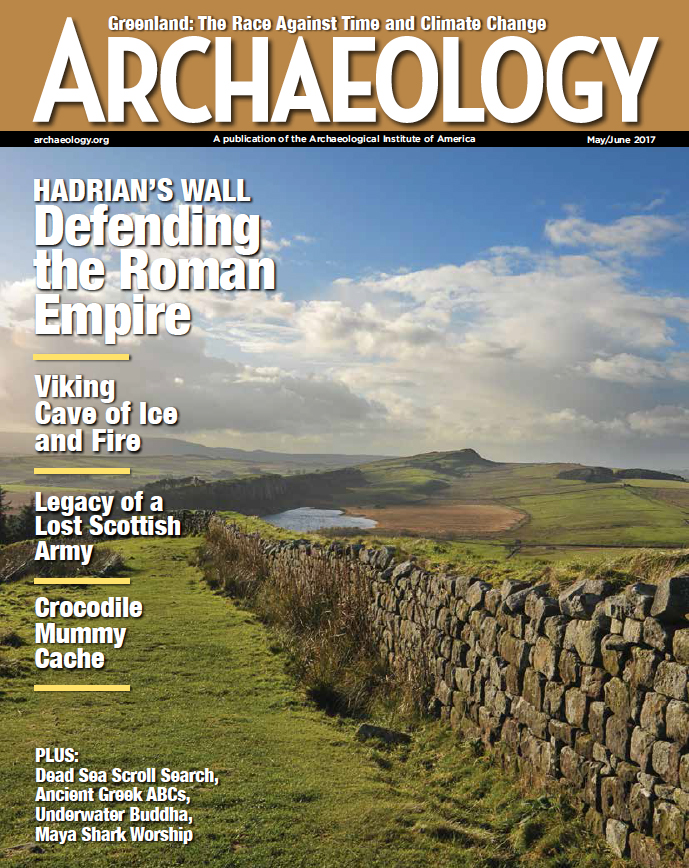 May/June 2017
-
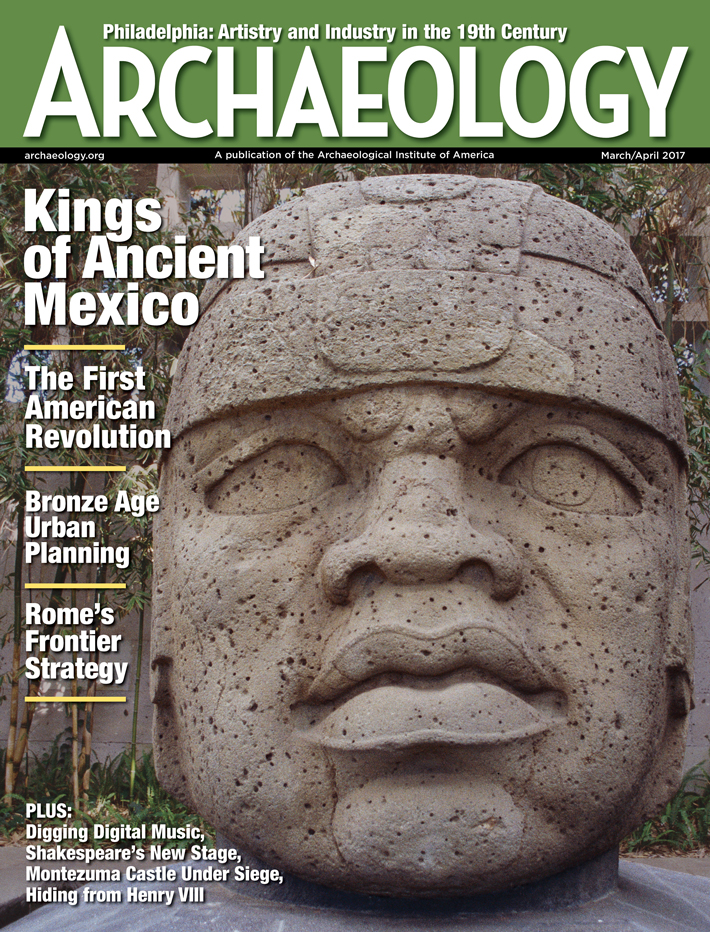 March/April 2017
-
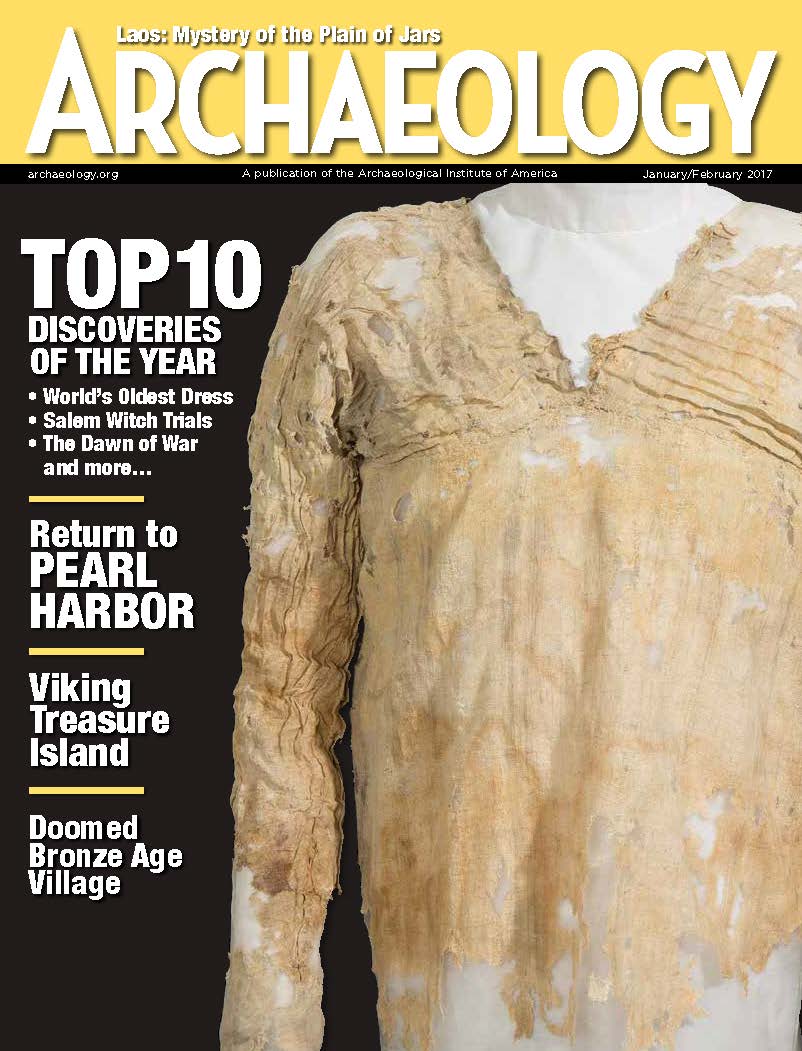 January/February 2017
-
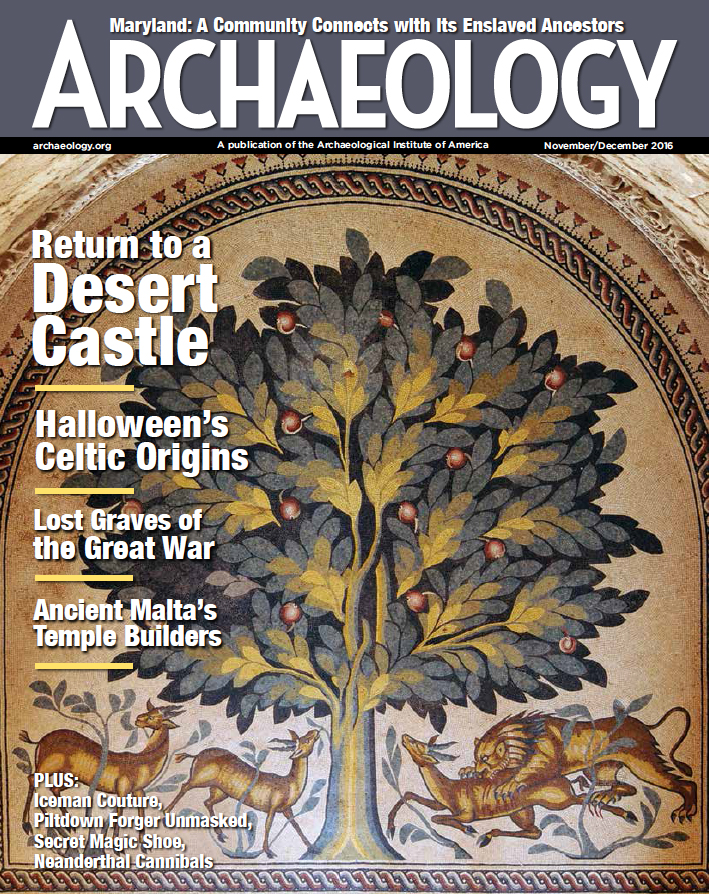 November/December 2016
-
 September/October 2016
-
 July/August 2016
-
 May/June 2016
-
 March/April 2016
-
 January/February 2016
-
 November/December 2015
-
 September/October 2015
-
 July/August 2015
-
 May/June 2015
-
 March/April 2015
-
 January/February 2015
-
 November/December 2014
-
 September/October 2014
-
 July/August 2014
-
 May/June 2014
-
 March/April 2014
-
 January/February 2014
-
 November/December 2013
-
 September/October 2013
-
 July/August 2013
-
 May/June 2013
-
 March/April 2013
-
 January/February 2013
-
 November/December 2012
-
 September/October 2012
-
 July/August 2012
-
 May/June 2012
-
 March/April 2012
-
 January/February 2012
-
 November/December 2011
-
 September/October 2011
-
 July/August 2011
-
 May/June 2011
-
 March/April 2011
-
 January/February 2011
Advertisement


